 fig 1
fig 1
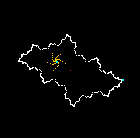 fig 2
fig 2
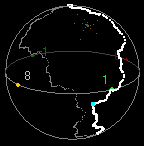 fig 3
fig 3
Mandel is a Java applet which draws the Mandelbrot set in detail, and shows the relation between the Julia sets and the Mandelbrot set.
As one can see with OTIS, the dynamics of f(z)=zz+C and the shape of its julia set strongly depends on the complex parameter c. Mandel shows this dependence by real-time slide shows.
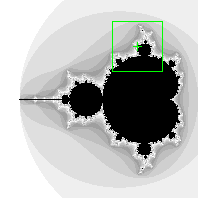
When the applet starts, whole the Mandelbrot set is already drawn. This initial picture is a part of the parameter space, C-plane, with Re C in [-2.3, 0.7] and Im C in [-1.5, 1.5]. To magnify the picture, drag the mouse and draw a yellow square on it such that the square bounds the region where you want to magnify. When the mouse button is released, the square turns into green (fig 1). Then press the button Draw Mandel (fig 4). For more precise pictures, increase the number of iteration of the calculation with the Choice-Box labeled like iteration=****. To reset the picture to the initial range, just press Reset. The parameter value pointed by the mouse cursor is shown in the Text-Boxes below.
fig 1
fig 2
fig 3
When the mouse cursor moves around, a small black window (Julia window) is drawn on the right side of the picture of C-plane (fig 2). This is a part of the complex plane, where the dynamics by f(z)=zz+C acts. the range of the julia window is fixed, with both Re z and Im z within [-2, 2]. The white points very roughly show the Julia set of f(z)=zz+C with c pointed by the cursor. orange points are the critical orbit, the orbit of z=0. blue points are the fixed points.
If the Check-Box Riemann Sphere is checked, they are drawn on the Riemann sphere (fig 3). Drag Julia window to change the viewpoint. (As you can see, the point at infinity is denoted by 8.)
Make a plan for the trip first! Press Set Marks, then drag the mouse on the C-plane to set marks (yellow points) at the points you want to visit. The marks may look like a yellow curve when you drag the mouse slowly. The actual number of marks are shown below the Clear button, and the capacity is 1000 points per a tour. Now it's ready: Press Show Julia Tour. Precise pictures of the Julia sets corresponding to the C-values at the marks are drawn continuously(fig 4). It is like a slide show, or an animation. The speed of the tour depends on your machine, C-values you marked, and the number of iteration in the Choice-Box. (Increase this number for more precise pictures.) To erase the marks, just press Clear. One can also use this button to erase the green square before magnifying C-plane.
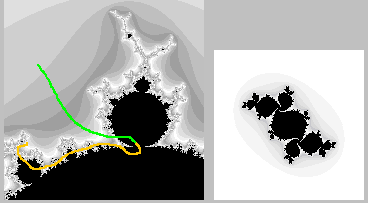 fig 4
fig 4
If Riemann Sphere Check-Box is checked, the Julia sets are drawn only on the visible side of the sphere (fig 5-7). Drag Julia window to change the viewpoint.
There are two options for the tour. Check Binary Julia to see the continuous change of the dynamics near infinity (fig 6). Check DistEstMthd to draw the Julia sets (and the Mandelbrotset)in Distance Estimating Method. In this mode, the invisible side of the sphere is partially drawn. (fig 7. The check at Binary Julia is ignored.)
 fig 5
fig 5
 fig 6
fig 6
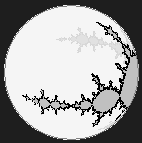 fig 7
fig 7
By pressing Ex. Ray button with rational p/q (or just real t like 1.41421356..) in the text box on the right, the external rays of angle p/q (or t) for the Mandelbrot set is approximately drawn in brown. To erace the ray, press Draw Mandel. Clear does not work for this (on purpose).
Similary equipotential curves of the Mandelbrot set are drawn by pressing EquiPot button. The number in the text box gives the potentail r of the curve. (In the current version 071129, r must be larger than or equal to 0.03.) Roughly put, the equipotential curve of radius r of the Mandelbrot set corresponds to the circle of radius exp(r) for the closed unit disk.
See the tutorial of OTIS and this note for more details on external rays and equipotentials.
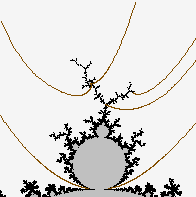 fig 8
fig 8
-- In the Julia tour, sometimes it takes pretty long time to draw pictures. It may happen at C-values near the boundary of the Mandelbrot set. To quit the tour, quit the browser itself....
--How to change the size of pictures? For more general remarks, see Java Applet Instructions.
The original version of this program, MANDEL-J was built in 2001. In this current version, MANDEL-J is renamed into Mandel.
2004/12/20: Added DEM checkbox and External Ray Button for the Mandelbrot set.
2005/10/09: Typing Enter(Return) Key in the text box below "Ex. Ray of Angle" works for drawing external rays.
2007/11/29: Equipotential cueves are available (but only for r >= 0.03).