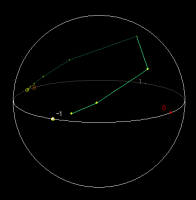
 fig 1
fig 1
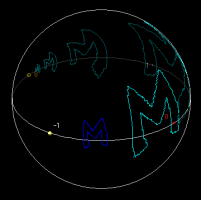
 fig 2
fig 2
For real a, b, c, d, the function T(z)=(az+b)/(cz+d) defined on the riemann sphere is called a real Moebius transformation. Moebius is a Java applet which shows the actions of real Moebius (and complex affine) transformations . This applet is designed for high school or first grade undergraduate students.
The real coefficients a, b, c, d of T(z)=(az+b)/(cz+d) are given in the text-boxes of the applet.
*****CAUTION!!***** When you input new coefficients, press Clear/Reset to activate the change.
In general, it is convenient to normalize a, b, c, d by replacing a/K, b/K, c/K, d/K where K is the square root of |ad - bc|. The button Normalize execute this normalization. Surely there may be a problem when ad - bc = 0. in this case t(z) is a constant function and is not interesting.
When the applet starts, the Riemann sphere and the real axis (plus infinity denoted by 8) are drawn. When your mouse cursor moves on them, the applet recognize that the cursor is moving on the semi-sphere of our side. Corresponding z-coordinate on the complex plane will be shown in the bottom of the applet. (This z-coordinate is given by the projection from the Riemann sphere on the complex plane. Thus the orientation inside the sphere corresponds to that of the plane.) Yellow circles show the positions of fixed points of T(z).
When you drag the mouse on the sphere, forward images of the point at the cursor (we call it pointwise orbit) is shown by yellow heavy dots with green segments joining them (fig 1).
To change the viewpoint, press the button Rotate Sphere and drag the sphere. The sphere rotates as you drag, and is fixed again when you release the mouse button.
To erase the real axis, deactivate the Check-Box labeled Real Axis.
 fig 1
fig 1
 fig 2
fig 2
Moebius has a similar function of OTIS. You can see the forward and backward images of any curves which you draw by the mouse.
First, press Set Marks, then drag the mouse on the sphere and draw any curve you like. Actually this curve is a set of marks joined by segments, and the number of marked points is shown above the button.
To see the forward image of this curve by the action of T(z), press Forward Image. To see the next forward image, press Forward Image again. In general, the image by N-th iteration of T(z) will be shown by pressing this button N times. (fig 2)
To see the backward image of the curve by the action of T(z), (that is, the image by the action of the inverse function of T(z)), press Backward Image. To see the next backward image, press Backward Image again. In general, the backward images by N-th iteration of T(z) will be shown by pressing this button N times.
To clear the sphere, press Clear/Reset.
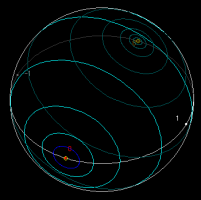
 fig 3
fig 3
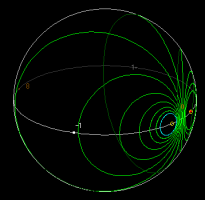
 fig 4
fig 4
You can set marks on a circle as follows: (1) Check the Check-Box Set Circle. (2) Press Set Marks. (3) Choose the center (say C) of the circle by pressing mouse button. (4) Choose a point (say P) on the circle by dragging mouse. Then marks are set on a circle in the Riemann sphere which corresponds to the circle |z-C|=|P-C| in the complex plane. (fig 3, 4)
***CAUTION!*** There still is a problem when one choose a circle passing near infinity....
To quit joining the pointwise orbit by segments, deactivate the Check-Box Segment. This also deactivate joining marks and their forward and backward images. In this case, marks and images are shown by heavy dots.
The other Check-Box Circle Dance activate the following: When mouse is dragged, the growth of the blue circle at the cursor along the pointwise orbit is ROUGHLY shown. Though it is based on the calculation of spherical derivative, you should consider it a decoration.
For more general remarks, see Java Applet Instructions.
2005/10/09 A minor bug is fixed.